LDS Membership Statistics 2020
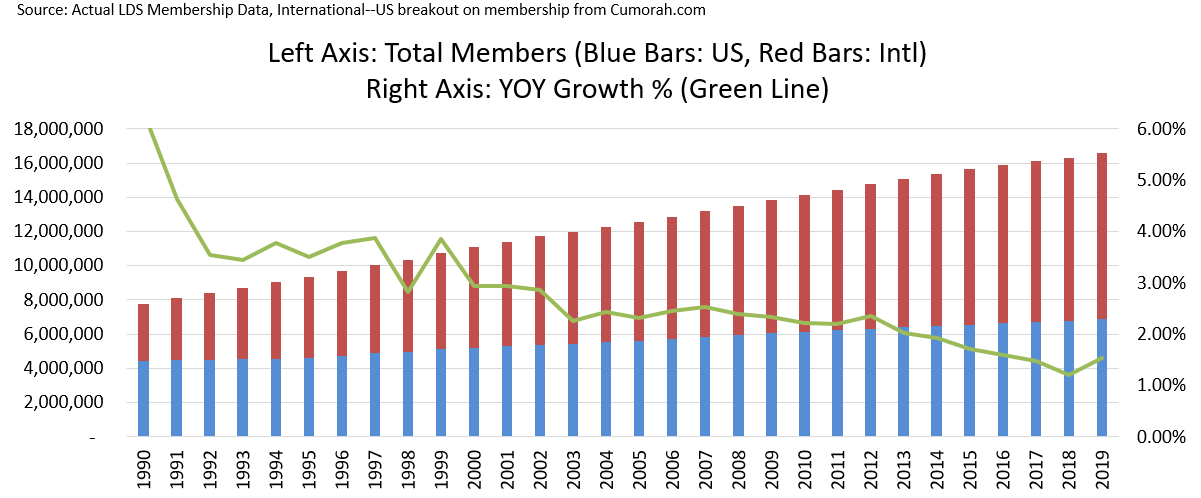
Here are my charts for the LDS Membership Statistics Report, updated with the numbers reported April 4, 2020. These statistics are for calendar year 2019. See last year’s statistical report here. In all, the numbers are very strong, reversing the declining trend of the last several years.
Total membership: 16,565,036, raw growth of 1.54% on prior year
Stakes: 3,437
Wards and Branches: 30,940
New children of record during 2017: 94,266
Converts baptized during 2017: 248,835
Full-time Missionaries: 67,021
Raw membership growth of 1.54% reverses a trend of six straight years of declining growth.
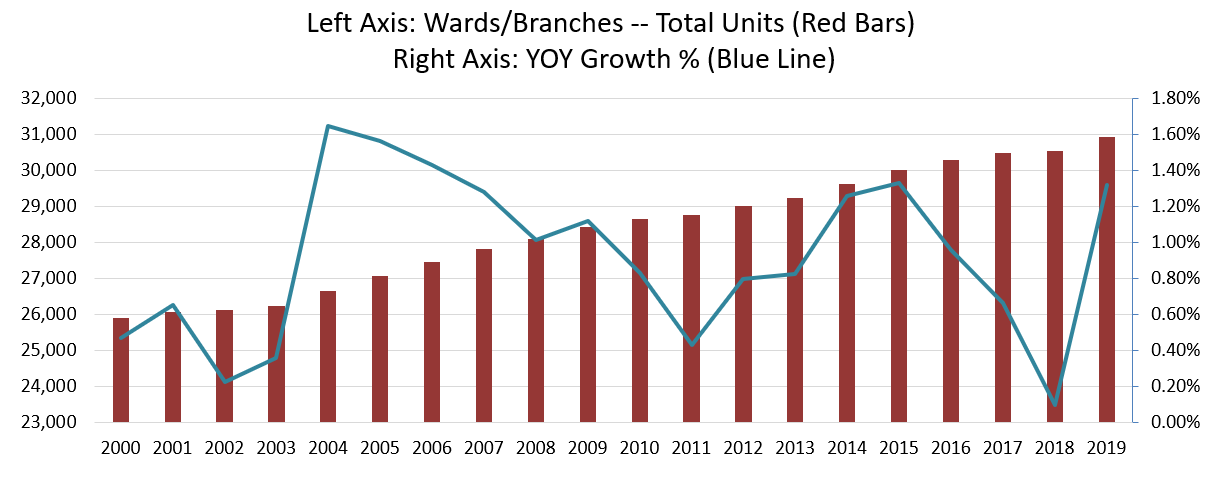
Total Units (Wards and Branches) was 30,940, an increase of 1.32% from the previous year. Best since four years ago 1.33%. Along with that 1.33% in 2015, that is best since 2006. This is a good indicator of growth in active members. Total membership is not the best number to use to determine actual growth, because there could be members going inactive that doesn’t reflect in total membership. Actual units also isn’t perfect, but is a better picture of how many people are actually going to church, and is pretty close to a true growth indicator.
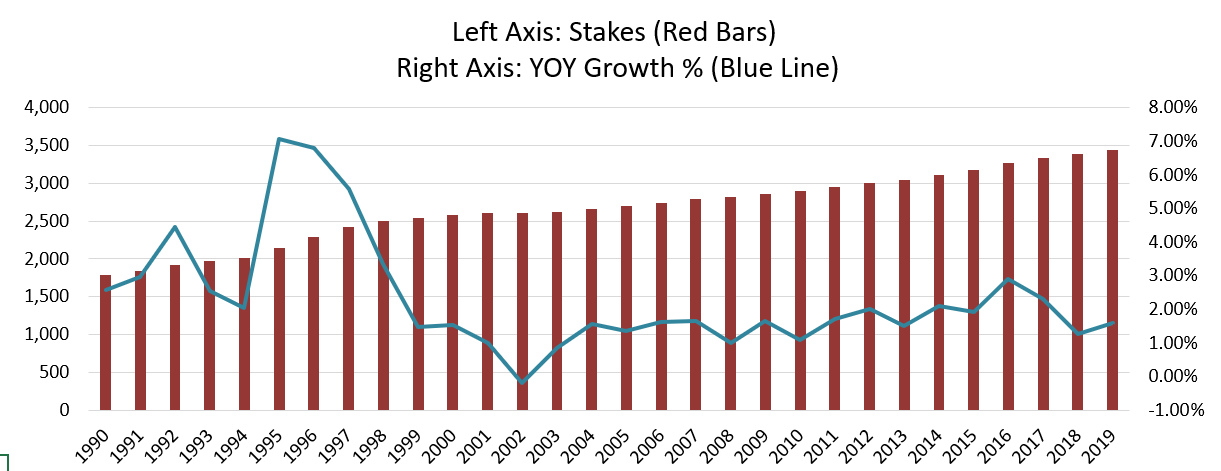
Stakes came in at 3,437. An increase of 1.60%. Theoretically units and stakes should both correlate and both be good growth indicators, but since unit to stake ratio is not perfectly consistent, I prefer the unit number over the stake number as a growth indicator.
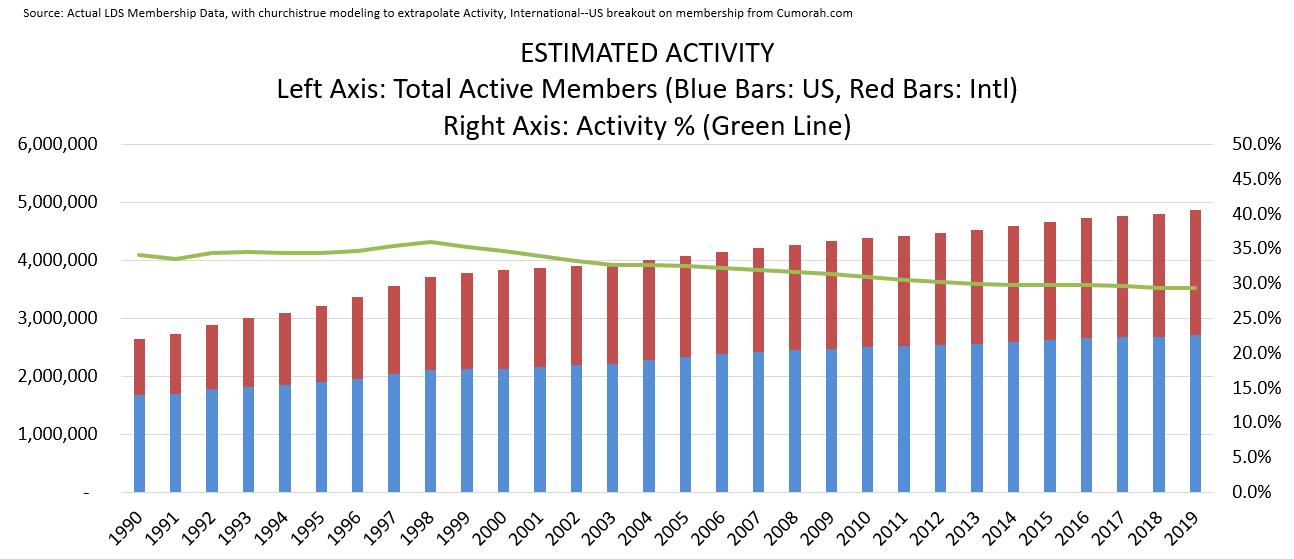
This next chart is a fun one, which I’ve put some effort into modeling. I had been running my own Excel model predicting and forecasting inactivity/activity rates. I combined this model with two other models. One by Matt Martinich, the premier LDS membership data guru, who is involved with the popular church demographics site Cumorah.com and has a personal blog on LDS membership data. The other by Kimball who provides a lot of analysis at his site Fuller Consideration. All three models were pretty close, but I refined my model based on information from all, and I think I have a pretty good model now, which essentially categorizes US and International wards and branches and then allocates an average member size to each and floats with unit changes broken out by US-Intl. I get the following chart this year.
Total active members: 4,867,694 with increase of 1.63% over the previous year and overall activity at 29.4% even from 29.4% last year.
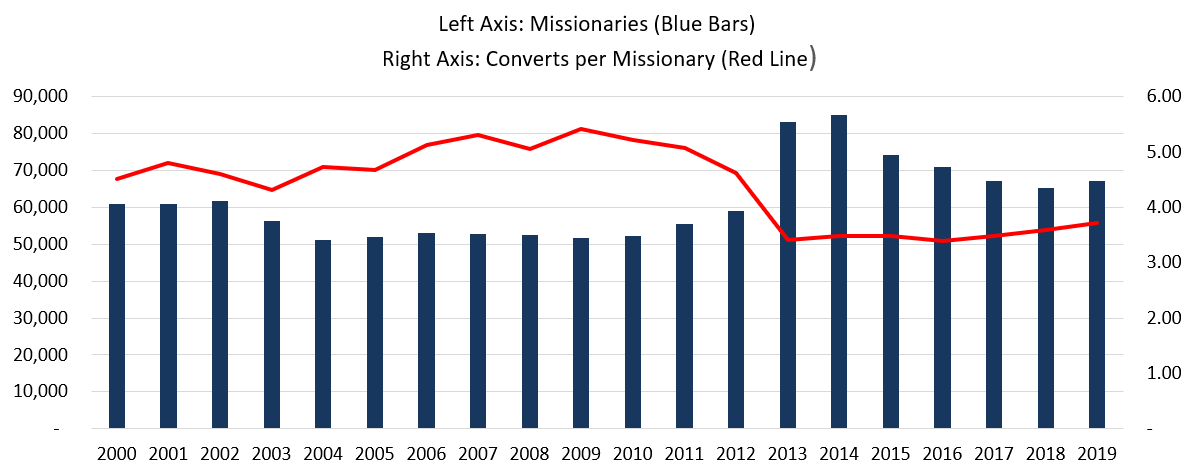
Missionaries are up to 67,021 (or they were up until they all had to come home due to COVID-19). This is up 2.9% from 2018. A very strong number. This number will be very interesting next year. Thirty years ago, would I have gone back to Korea after coming home for a few months midway through? I’m not sure. Converts per missionary is gradually increasing but not yet up to pre-surge numbers.
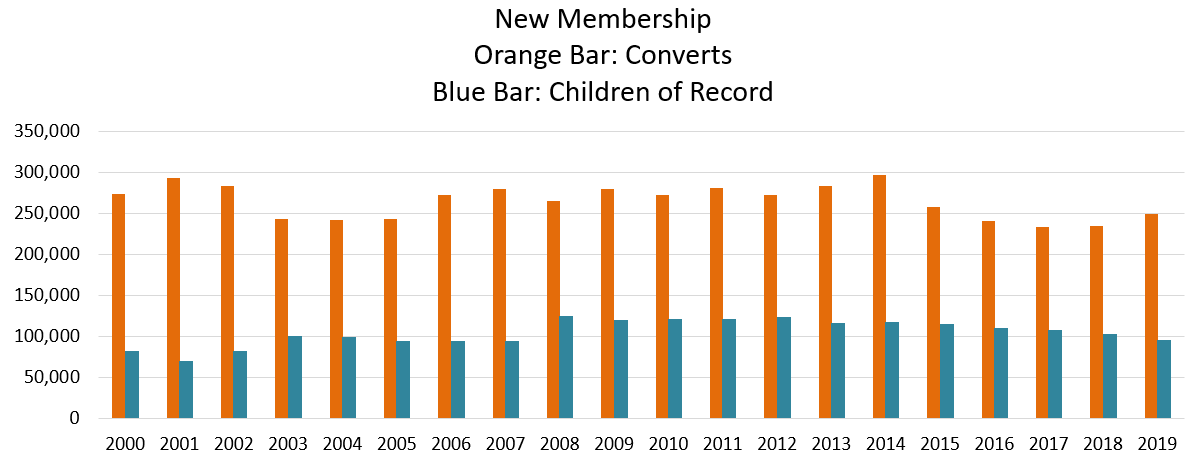
New converts were 248,835 with very solid growth of 6.2% on the prior year. Perhaps the mission boundary adjustments the last couple years have been effective.
Children of record came in at 94K. The church changed how it does its counting on this in 2008. In 2008, 123.5K children were reported. That number has steadily decreased since then down to 102K last year. The change to 94K this year is a huge drop. If the number is an organic change and not due to methodology change, some possible reasons: members having less children, members pushing out marriage and child bearing age, or impact of active members going inactive or resigning.
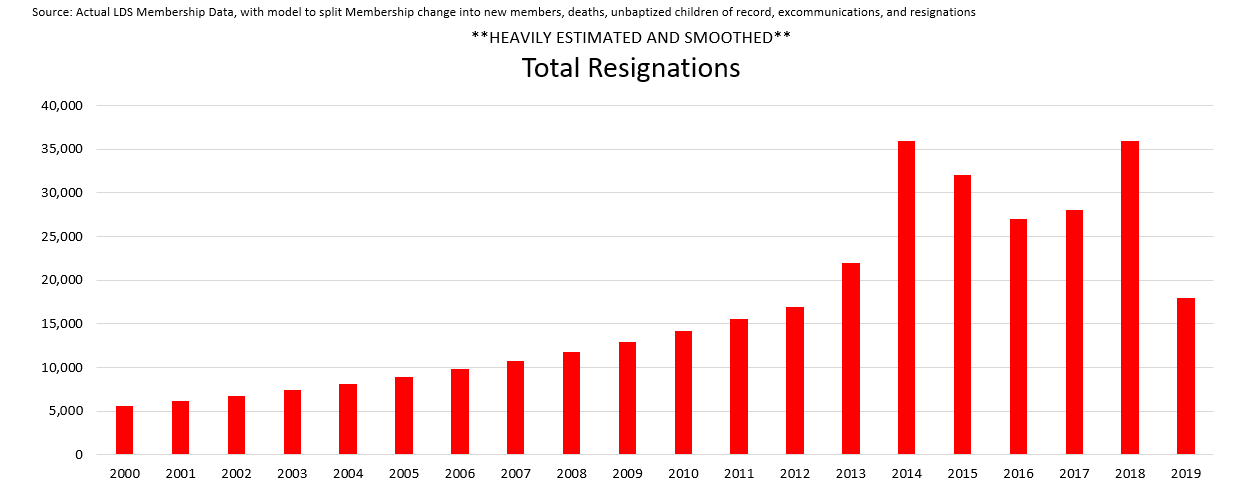
Next is total resignations. I am reporting 18,000 for 2019. This is very controversial and very difficult to model. The number is not reported directly. The number comes from total reduction in membership. Reduction in membership is calculated by taking change in membership less new converts less new children of record. The number this year was -91,800. This ‘plug’ number includes: deaths of members that are known, inactive members that can’t be located that reach age 110, children of record that turn age 9 and haven’t been baptized, excommunications, and resignations. This number of -91.8K is an outlier on the low side. Last year was -141K and five year previous average was -116K. Without doing any massaging, the -91.8K number would suggest total resignations was 9,000. But we know from the past that the church often does small adjustments and ‘true ups’ in their counting that cause this number to look wacky. I’m going to bump up resignations to 18K and adjust a couple previous numbers down. I think the best we can say on resignations is that over a seven year time period, they’ve averaged about 30K per year, but identifying a trend is probably impossible.
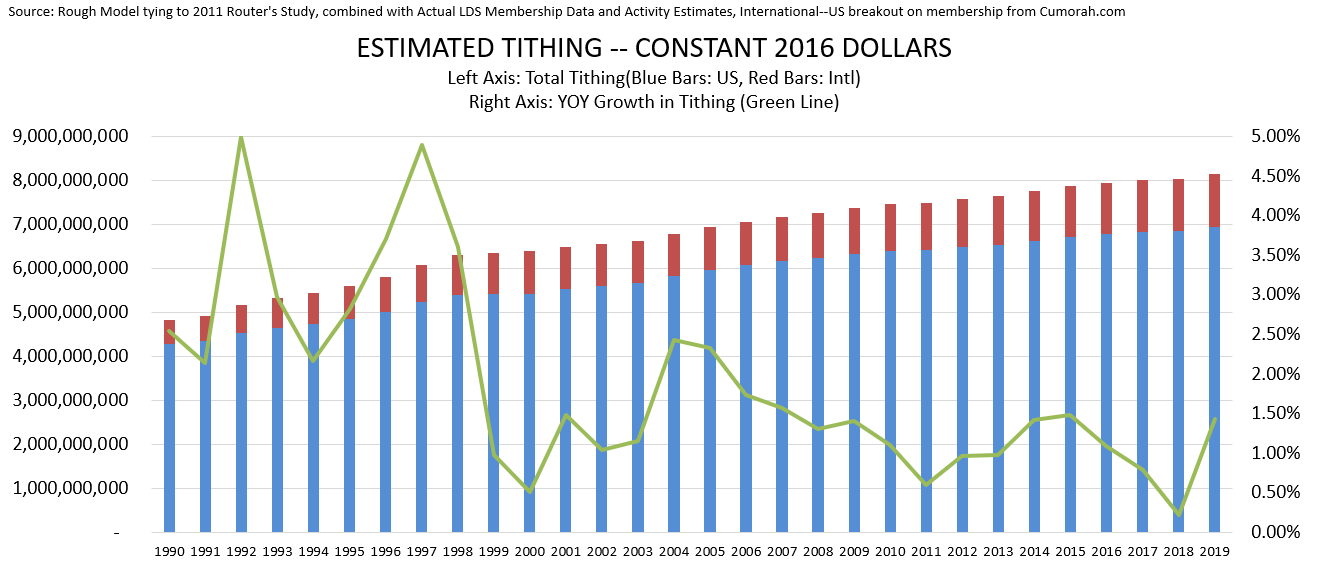
Tithing. I estimate total tithing in 2019 at $8.5B. That’s an increase of 1.43% using constant dollars on prior year. A large increase compared to previous years. Based on my model, this tracks with active members in the US.
Methodology: I took a report from a study by Reuter’s in 2011, and modeled out estimated tithing dollars. That study estimated tithing dollars by USA and International. I trended it out using activity estimates. Something insightful here is to compare the blue-red USA-Intl split here to the total membership in the first chart. If these estimated numbers are correct, then it shows a major issue the church faces. I imagine the growth that is coming internationally in membership is quite a burden of expense, considering the tithing appears to be minimal, relatively.
These numbers roughly correlate with the report from the ‘whistleblower’ who broke the story about the Church’s ‘rainy day fund’ created by investing surplus tithing dollars over a 30 year time period and growing to 1.2B today. Please see my blog post on an idea that could transform our missionary program by using that money to create a world class charitable service organization.
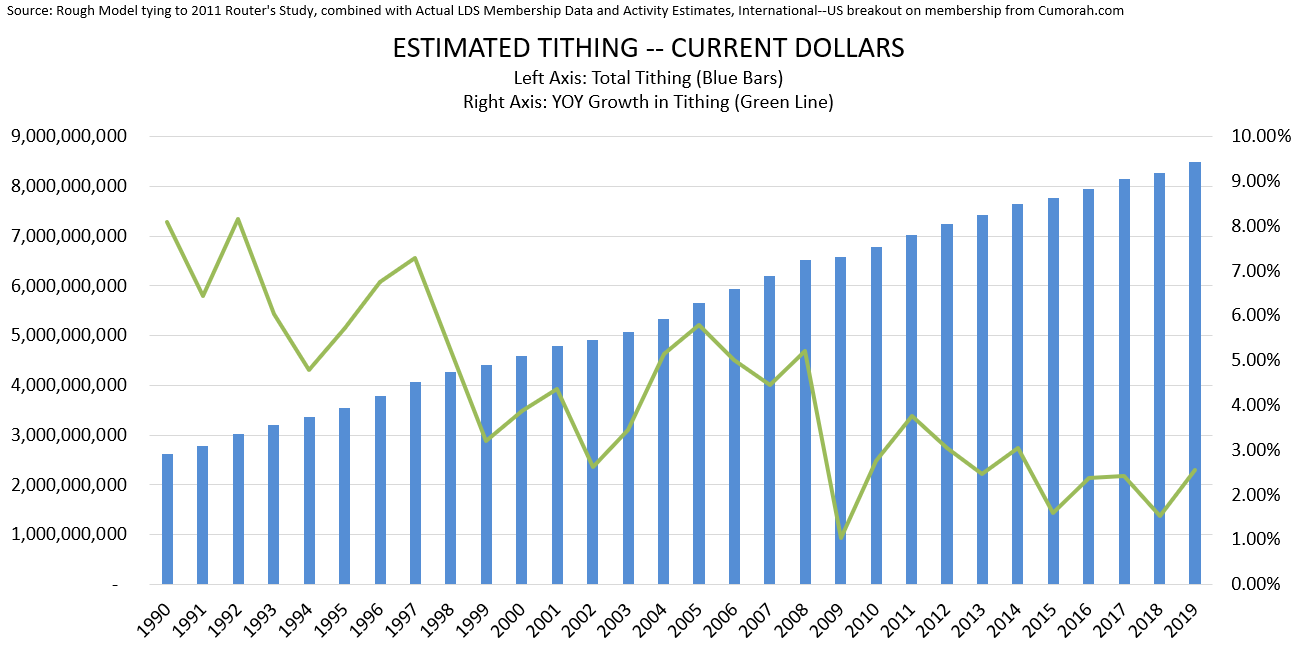
Here’s the same look in current dollars.
Why is the Church’s growth slowing? Some will say it’s related to CES Letter type issues. But this seems to be a global issue affecting all churches. Church growth may be solid when compared to other churches struggling to grow in an increasingly secular world. I give my insight into some of the growth challenges in a previous essay titled Why are people leaving the Mormon Church?
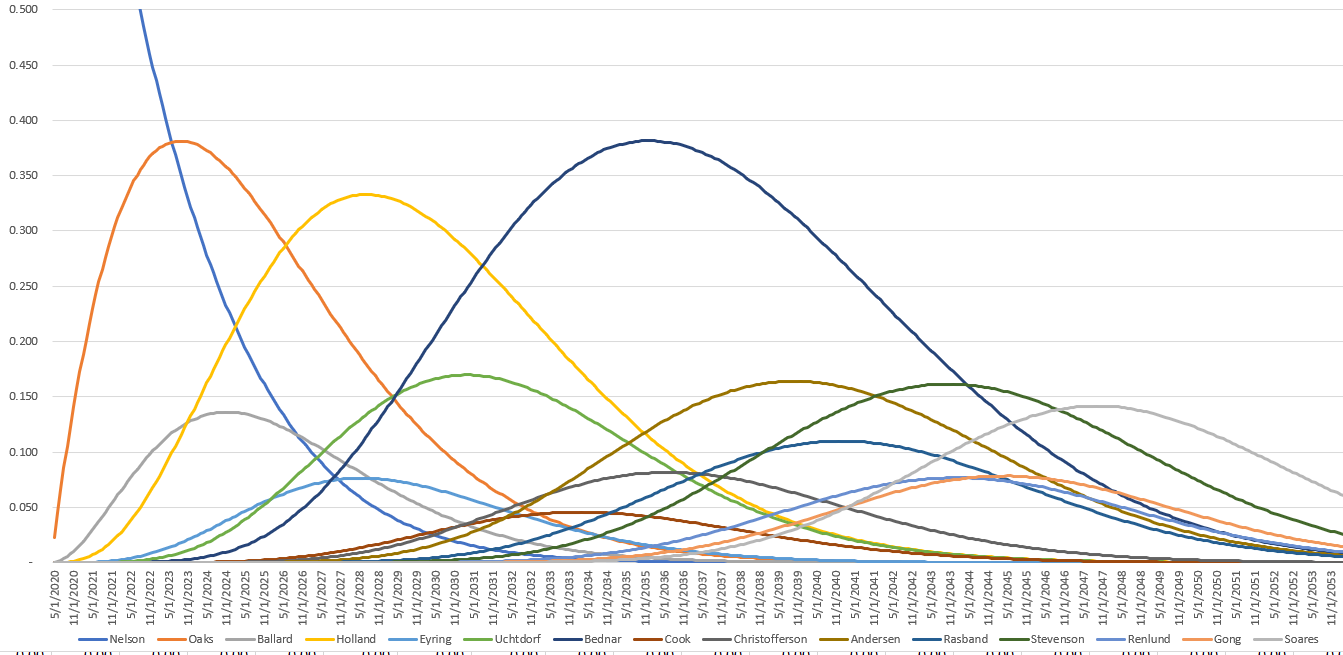
Here’s one final chart for fun showing probabilities for the current apostles to ascend to become the prophet of the Church based on seniority. This chart is using actuarial chart published by US gov for death probabilities for certain age. If everything goes according to expectations, Pres. Nelson would be replaced by Oaks in 2023, then Holland in 2026, Bednar in 2031, Stevenson in 2044, and Soares looking very fit in conference yesterday looks strong enough to last until he becomes the first international prophet Soares in 2046. Uchtdorf and Andersen also have pretty decent shots at becoming the prophet.
