LDS Membership Statistics Report 2017
This report is for 2016 published in 2017. For the new report published 3/31/2018 for calendar year 2017 click here.
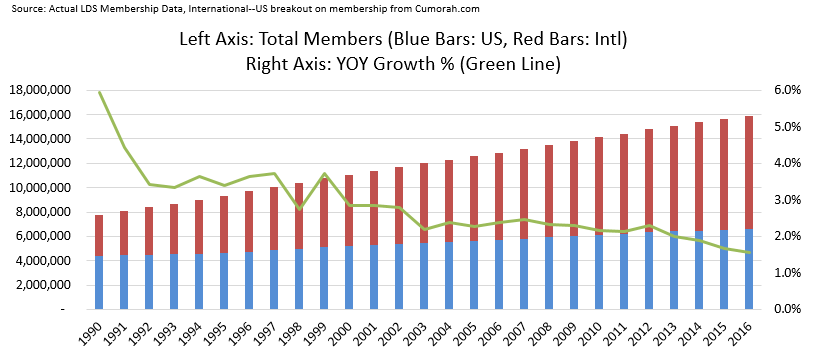
Here are my charts for the LDS Membership Statistics Report, updated with the numbers reported April 1, 2017.
Total members of 15,882,417, raw growth of 1.56% on prior year.
Total Units (Wards and Branches) was 30,304, an increase of 0.96% from the previous year. This is a good indicator of growth in active members.
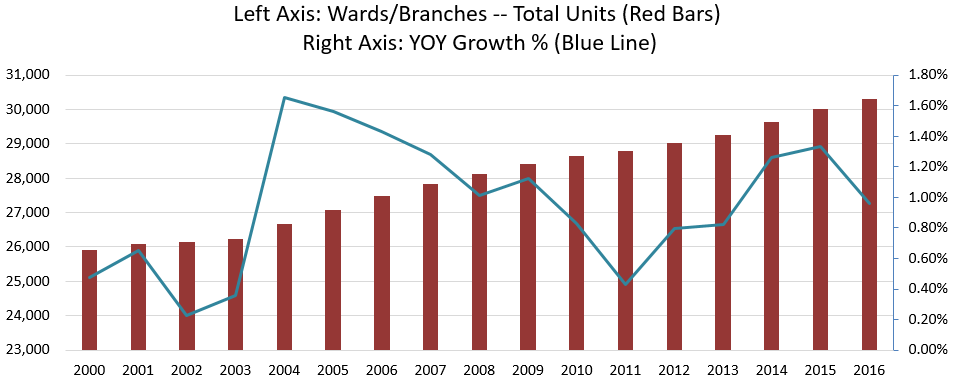
Stakes came in at 3,266. An increase of 2.9%. With stake growth outpacing unit growth and active member growth, it appears the Church is implementing a strategy to decrease the number of units or active members per stake.

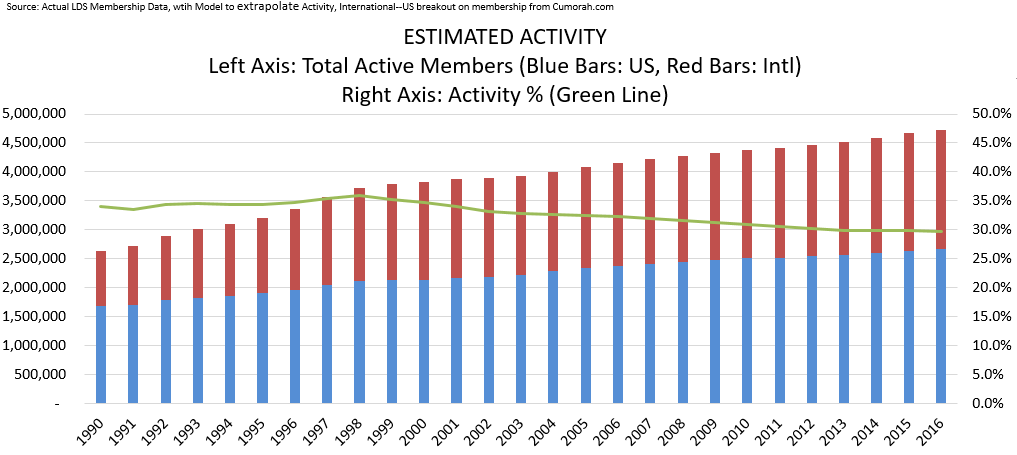
This next chart is a fun one, which I’ve put some effort into modeling. Last year, I produced this chart with a total activity level of 33.6%. I analyzed two other models on activity rates. One by Matt Martinich, the premier LDS membership data guru, who is involved with the popular church demographics site Cumorah.com and has a personal blog on LDS membership data. The other by Kimball who provides a lot of analysis at his site Fuller Consideration. They both independently came to a number of about 30% for 2013. So I used that as a baseline in my model, which derives activity based on average attendance assumptions for US and International wards and branches. I get the following chart this year.
Total active members: 4,724,280 with increase of 1.28% over the previous year and overall activity at 29.7%.
Missionaries are down to 70,946. I think this will probably be the new run rate. We had the huge increase where the mission age change created a huge jump. And now we’ve seen that flush through and appear to be at equilibrium. I really like the mission age change, especially relating to the sisters. I’d like to see the mission age the same 18 for both, but I think dropping from 21 to 19 was great. My daughter was one of the first girls in the church to have her mission papers in before high school graduation. And I have my second daughter out now. It’s been great for both of them.
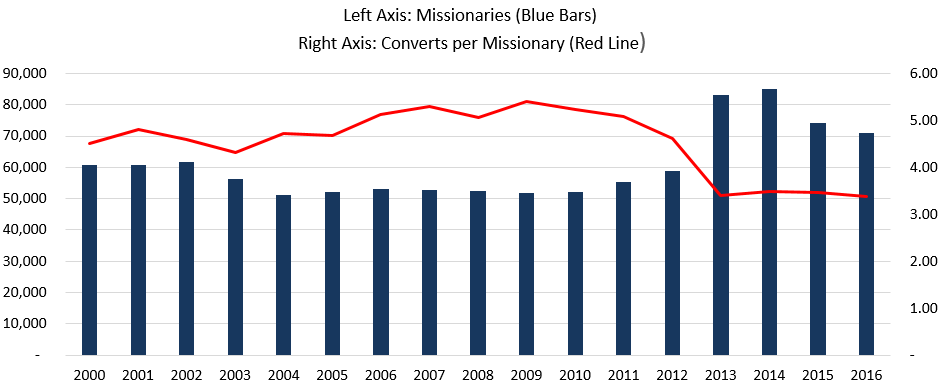
New converts were 240,131. Lowest number since 1987. Come on missionaries. Time to lengthen your stride. Back in my day we baptized twice as much as you. And we had to walk uphill both ways in the snow and heat.

Next is total resignations. This is very controversial and very difficult to model. The number is not reported directly. The number comes from total reduction in membership. Reduction in membership is calculated by taking change in membership less new converts less new children of record. The number this year was -101,159. This ‘plug’ number includes: deaths of members that are known, inactive members that can’t be located that reach age 110, children of record that turn age 9 and haven’t been baptized, excommunications, and resignations.
Due to changes in methodology in the way the church reports, and also due to so many factors that go into modeling these five categories, it’s very difficult to peg this number accurately. Last year I took a stab at it, but I felt the resignation number I published was high. Since then, I’ve read everything I could on the subject. I talked to several other data modelers who play with this data. I realized I had some weaknesses in my model last year, and revised that model. This is my new estimate on total resignations. 20,000 for 2016. I do not mean to suggest this spike in 2014 and downward trend is accurate. I trended the data previous to 2012 because it fit the data to trend that way. I smoothed the data in the time period 2013 – 2016 a little, but did not try to apply a trend. I assume there are probably adjustments of sorts in that data that take away the accuracy of trending.
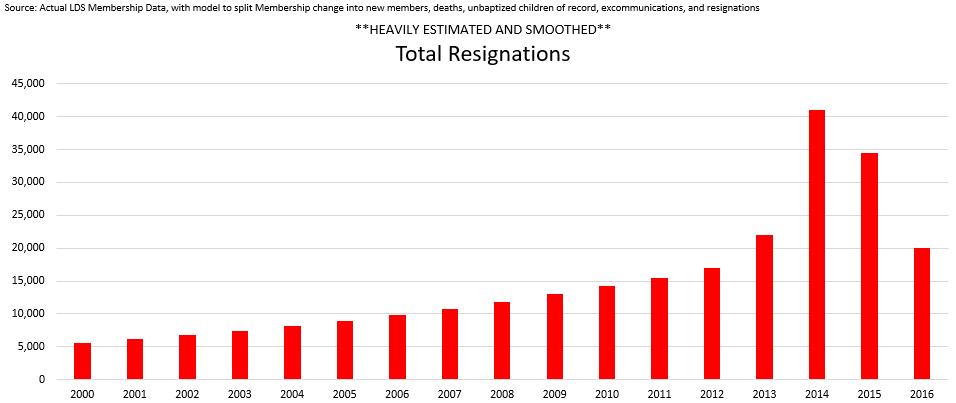
It’s very possible the church could announce some change in their methodology since 2013ish that could account for all this, outside of resignations, but dealing with the data we have, resignations seems the only likely reason for the increase. The average for the ‘plug’ number 2008 to 20012 was -77,923. The average for the last four years was -108,257. So something is definitely happening in this ‘plug’ category.
Tithing
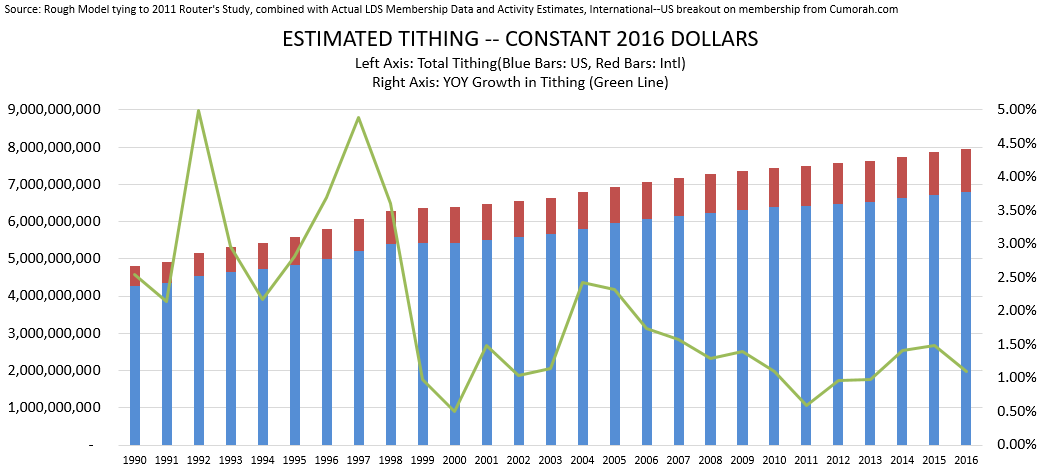
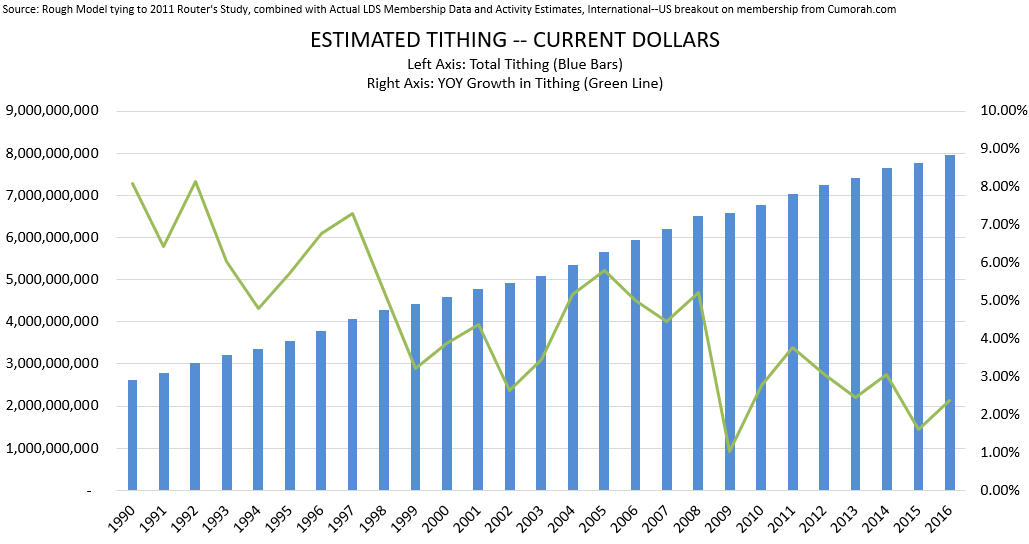
Here’s another fun one. I took a report from a study by Reuter’s in 2011, and modeled out estimated tithing dollars. That study estimated tithing dollars by USA and International. I trended it out using activity estimates. Something insightful here is to compare the blue-red USA-Intl split here to the total membership in the first chart. If these estimated numbers are correct, then it shows a major issue the church faces. I imagine the growth that is coming internationally in membership is quite a burden of expense, considering the tithing appears to be minimal, relatively.
Here’s the same look in current dollars.
Why is the Church’s growth slowing? Some will say it’s related to CES Letter type issues. But this seems to be a global issue affecting all churches. Church growth may be solid when compared to other churches struggling to grow in an increasingly secular world. I give my insight into some of the growth challenges in a previous essay titled Why are people leaving the Mormon Church?
RCB
What is YOY In the graph?
churchistrue
Year over year.
Clark Goble
Nice charts.
Grant Durtschi
Shouldn’t new membership minus resignations equal raw growth?
Chris Said
Hi, very interesting graphs! Can I ask where you obtained the data? I’m interested in seeing a US/International membership breakdown going back earlier than 1990.
WayneJ33
I like missionary work but there needs to be more going abroad and less in the states. Here in Utah and in most of the states missionaries are basically just doing work the members should be doing and unless they’re really following the spirit tracting is pointless. There definitely needs to be more change than just an age adjustment.