LDS Membership Statistics 2018
Here are my charts for the LDS Membership Statistics Report, updated with the numbers reported March 31, 2018. These statistics are for calendar year 2017. See last year’s statistical report here.
Total membership: 16,118,169
Stakes: 3,341
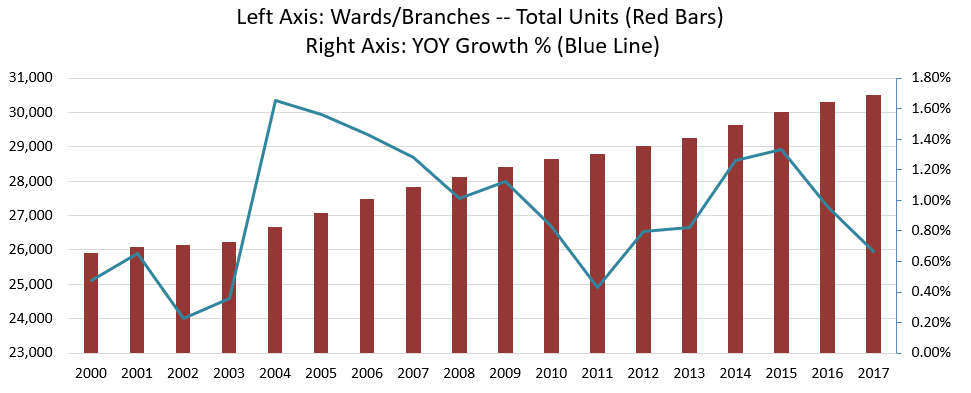
Wards and Branches: 30,506
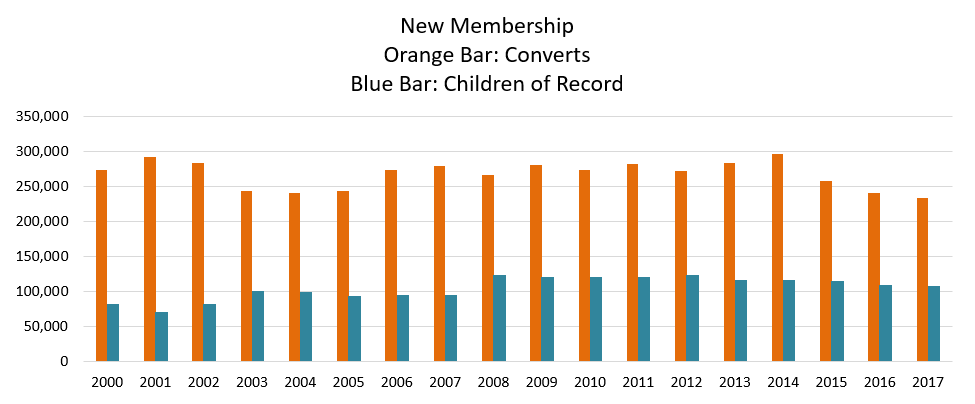
New children of record during 2017: 106,771
Converts baptized during 2017: 233,729
Full-time Missionaries: 67,049
Total members of 16,118,169, raw growth of 1.48% on prior year. Last year’s 1.59% was the lowest since 1937, and this year continues the downward trend.

Total Units (Wards and Branches) was 30,506, an increase of 0.67% from the previous year. This is a good indicator of growth in active members. There are new converts but also new people going inactive to offset some, but the increase in total wards and branches should be pretty close to a true growth indicator.
Stakes came in at 3,341. An increase of 2.3%. Similar to last year, with stake growth outpacing unit growth and active member growth, it appears the Church is implementing a strategy to decrease the number of units or active members per stake.

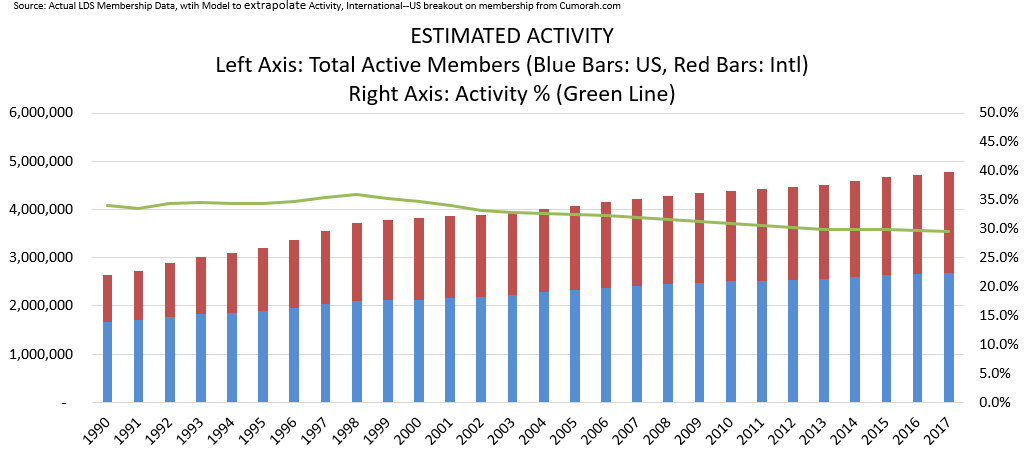
This next chart is a fun one, which I’ve put some effort into modeling. I had been running my own Excel model predicting and forecasting inactivity/activity rates. Last year, I spent some time analyzing a couple other models. One by Matt Martinich, the premier LDS membership data guru, who is involved with the popular church demographics site Cumorah.com and has a personal blog on LDS membership data. The other by Kimball who provides a lot of analysis at his site Fuller Consideration. All three models were pretty close, but I refined my model based on information from all, and I think I have a pretty good model now, which essentially categorizes US and International wards and branches and then allocates an average member size to each and floats with unit changes broken out by US-Intl. I get the following chart this year.
Total active members: 4,770,546 with increase of 0.98% over the previous year and overall activity at 29.6% down from 29.7% last year.
Missionaries are down to 67,049. This is down 5.5% from 2016. I think this is a troubling statistic. I thought the number last year of 70,946 represented the full drop from the peak of 85,147 in 2014. We know that was a false peak because the age change caused missionaries from multiple age classes serving together. I thought that was all flushed out of the system and 2016 would be the bottom and expected small increase increase on that for 2017. My recommendation for mission work is to call all young women on missions the same as young men, make the age they go out the same, make the mission length the same, and promote it in their young men’s and young women’s programs the same.
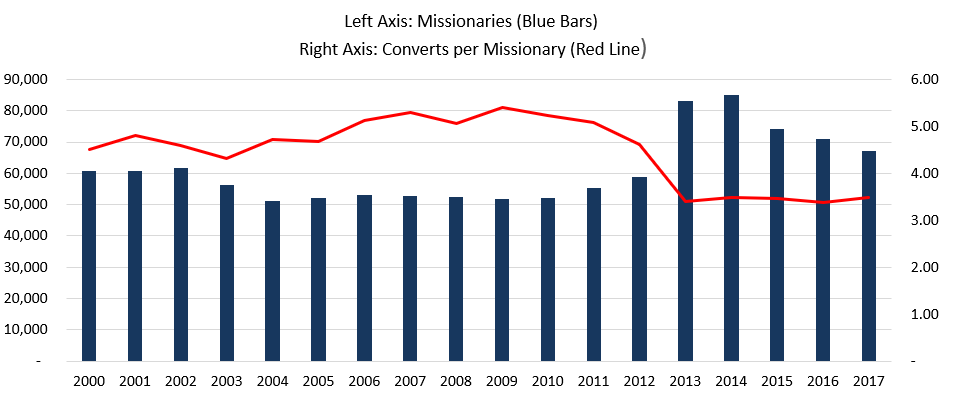
New converts were 233,729. Last year of 240K was the lowest number since 1987. This year sunk lower.
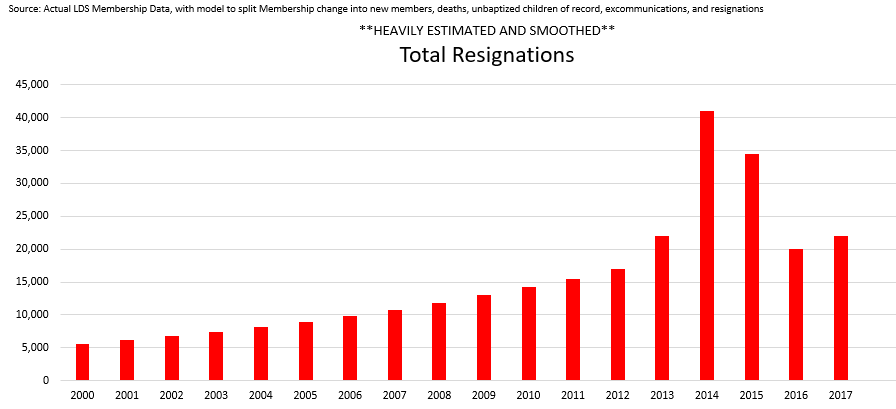
Next is total resignations. 22,000 for 2017. This is very controversial and very difficult to model. The number is not reported directly. The number comes from total reduction in membership. Reduction in membership is calculated by taking change in membership less new converts less new children of record. The number this year was -104,478. This ‘plug’ number includes: deaths of members that are known, inactive members that can’t be located that reach age 110, children of record that turn age 9 and haven’t been baptized, excommunications, and resignations.
Due to changes in methodology in the way the church reports, and also due to so many factors that go into modeling these five categories, it’s very difficult to peg this number accurately. I’m not sure if the peak 2014 and 2015 is meaningful or if it’s due to some change in membership accounting (probably the latter). The Church seems to occasionally do ‘true ups’ or or other strange things to the data, and since this is a plug, it all flows through to this number. Very volatile and likely inaccurate. But I’ve talked to the other data modelers and looked at various analysis and feel it’s about as good as we can guess. Also, since there has been relatively smooth numbers the last two years in a row, I think this 2017 number of 22,000 is probably a pretty good guess.
Tithing
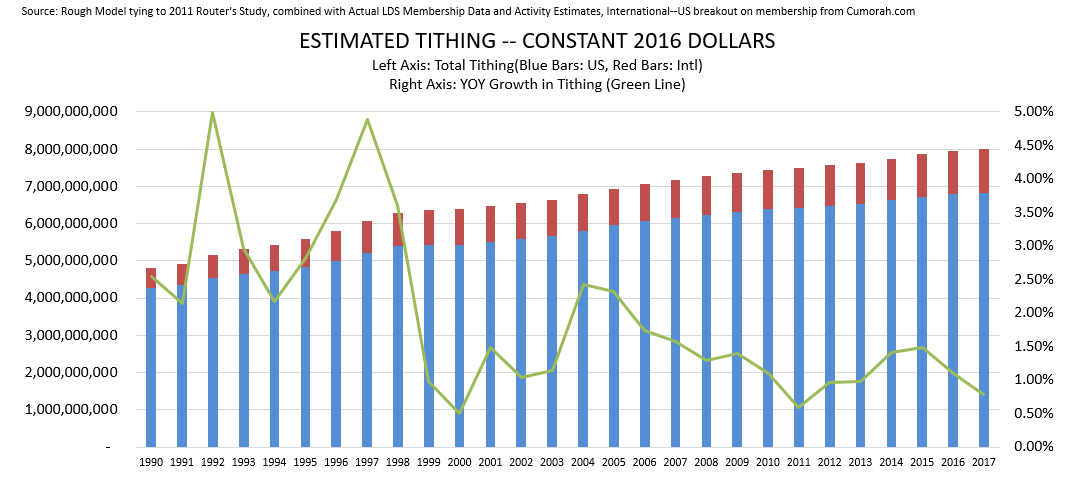
Here’s another fun one. I took a report from a study by Reuter’s in 2011, and modeled out estimated tithing dollars. That study estimated tithing dollars by USA and International. I trended it out using activity estimates. Something insightful here is to compare the blue-red USA-Intl split here to the total membership in the first chart. If these estimated numbers are correct, then it shows a major issue the church faces. I imagine the growth that is coming internationally in membership is quite a burden of expense, considering the tithing appears to be minimal, relatively.
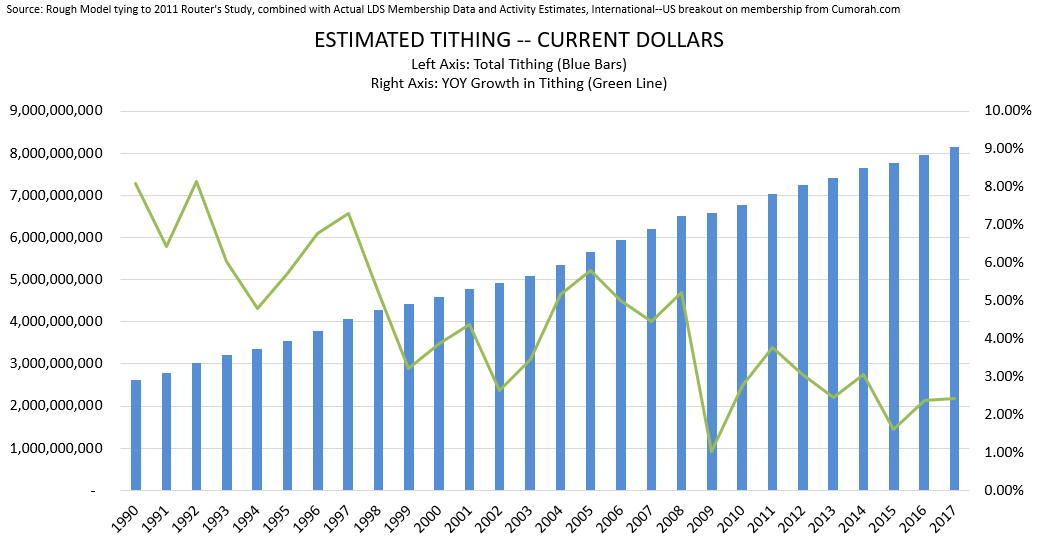
Here’s the same look in current dollars.
Why is the Church’s growth slowing? Some will say it’s related to CES Letter type issues. But this seems to be a global issue affecting all churches. Church growth may be solid when compared to other churches struggling to grow in an increasingly secular world. I give my insight into some of the growth challenges in a previous essay titled Why are people leaving the Mormon Church?
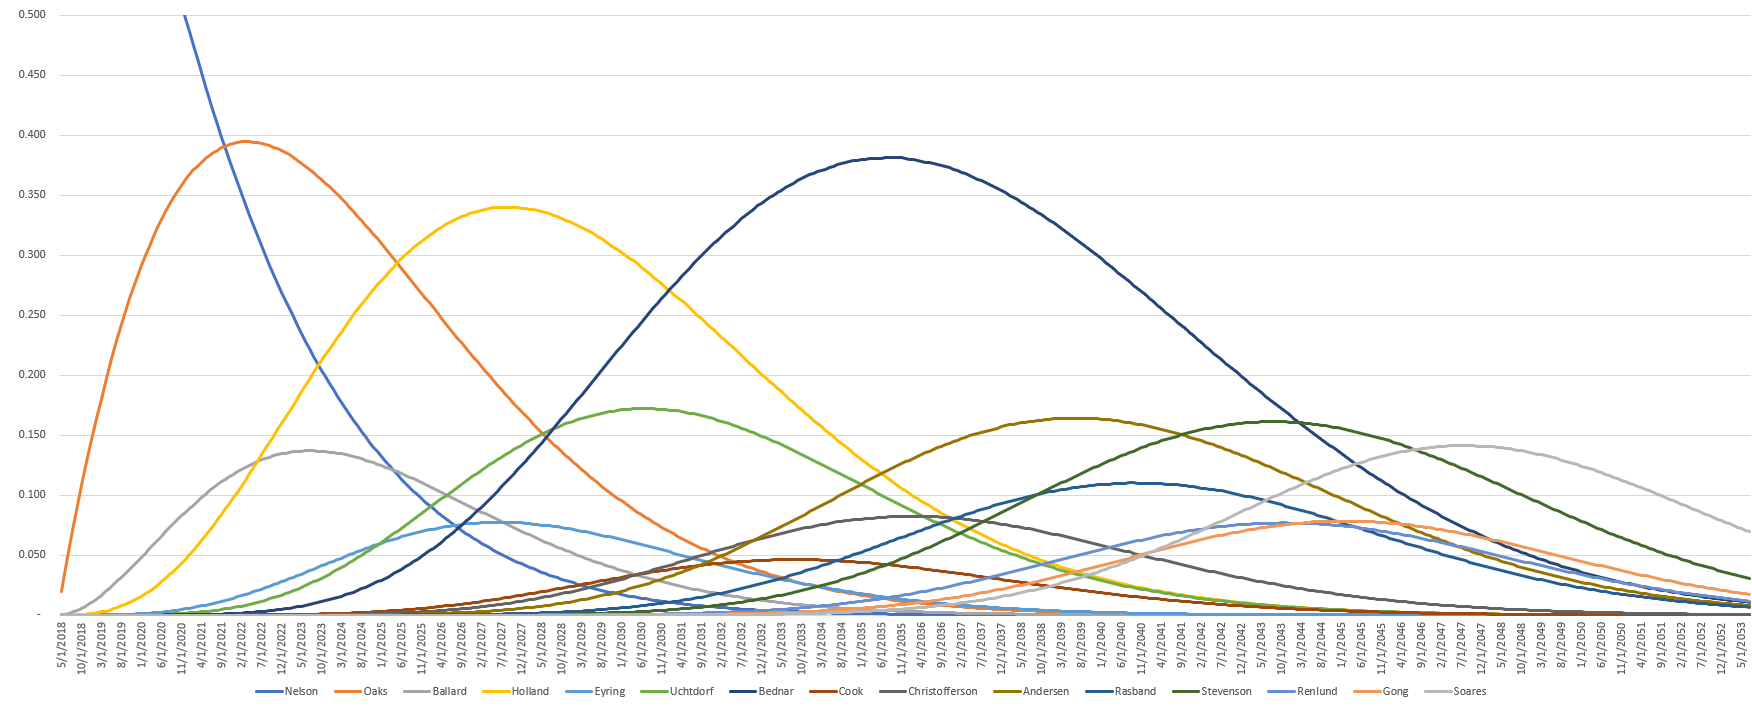
Here’s one final chart for fun showing probabilities for the current apostles to ascend to become the prophet of the Church based on seniority. This chart is using actuarial chart published by US gov for death probabilities for certain age. If everything goes perfectly according to expectations, Pres. Nelson would be replaced by Oaks in 2021, then Holland in 2025, Bednar in 2030, Stevenson in 2044, and new apostle and possibly first international prophet Soares in 2046. Uchtdorf and Andersen also have pretty decent shots at becoming the prophet.
Brandon Shumway
Wow, this data is pretty amazing! That’s incredible how fast you put all that together after the statistics were released.
Prairiemom3
Another way to increase missionary numbers: Allow missionaries to go on service missions. Real service missions, like digging wells and building schools, not weeding the flower beds at Temple Square or being a caretaker at church facilities. Even if it was an 80-20 split, (80% service, 20% proselyting) I think you’d get a huge boost in missionary numbers and who knows? maybe even a boost in baptisms.
Gregory Spencer Hill
I do think that option would inspire a lot of youth to serve, and might actually inspire more conversions than strict reliance on our door-to-door salesman approach, which strikes too many as a bit plastic and superficial (a la Bernstein’s Trouble in Tahiti).
Our Mission President is offering up our elders and sisters to serve as volunteers in local servíce projects in part to keep their spirits up and in part, I think, to deepen the missionary experience to include profound friendships with people who may never convert but who will be remembered with affection.
shakeyquant
One source of data that may be helpful is the @quitmormon twitter app. The lawyer who processes resignations at quitmormon.com posts stats on the resignations he has processed. 16k as of a few days ago.
rogerdpack
I don’t see where there are YoY stats or what not though…so that’s 16k as of ‘the lifetime of the site’…?
Andrew J
Great reports. Love that you did some original analysis with the raw stat report that’s put out by the Church. I was looking for info about full time missionaries and book of Mormon translations for my lesson tomorrow. the talk I am studying has numbers from a few years ago. I wanted an update, it took a couple searches, glad I came across your blog.